
“If our economy seems to be growing but that growth is not sustainable because we are destroying the environment and using up scarce natural resources, our statistics should warn us. But because GDP didn’t include resource depletion and environmental degradation, we typically get an excessively rosy picture.”
– Joseph Stiglitz, Nobel Prize Winner
The standard way to measure economic performance of an area is to look at the gross domestic product (GDP), which is the total value of all the goods and services produced over a given period (usually by quarter or annually). It is sometimes referred to as “value-added” and is often used to describe the size of an economy and economic growth. If GDP doesn’t grow over time, we may officially be in a “recession”, according to the National Bureau of Economic Researchers.
While GDP can be a good proxy for looking at the economic output or total value of what is produced in an economy, it paints an incomplete, and sometimes distorted, picture of how well an economy is delivering broadly shared prosperity. This is true, for example, when we look at the economic growth associated with the shale fracking boom over the last decade. While there has been large growth in GDP associated with oil and gas industries in the Ohio River Valley (see graph below), the reality is only a small fraction of the income and wealth generated stays in the community or in the pockets of workers or residents.
It is widely understood that natural resource extraction and shared prosperity have not gone hand in hand in communities across Appalachia. There are only a few places in the world that have been able to successfully combine large scale natural resource extraction with economic diversity and broad-based long-term economic growth. And in those rare cases (e.g. Norway), they were successful because they were able to capture locally a large chunk of the economic value produced by the natural resources with adequate taxes and/or public ownership.
This post looks at the billions of dollars of GDP growth generated by the oil and gas industry in the region; how this wealth is disconnected from the general welfare of the people and communities where it is being generated; and why looking at GDP growth alone from oil and gas industries sheds more heat than light on the economic benefits of the industry in jobs, income, and overall public well-being.
Some of the key findings include:
- While the labor share – the amount of GDP paid out to employees in wages, salaries, and benefits – of all industries in the Ohio River Valley region ( Ohio, Pennsylvania, and West Virginia) is above 50%, for the oil and gas industry it is between 7% and 19%.The ultra small labor share in the oil and gas sector is reflective of the capital intensity of the fracking industry and the large amount of value of the natural resources being extracted.
- While total oil and gas GDP grew by $18.5 billion for the three Ohio River Valley states from 2010 to 2017, total compensation (wages and benefits) only grew by $1 billion – from $2.2 billion in 2010 to $3.2 billion in 2017.
- There are several reasons why the significant growth in oil and gas GDP has not corresponded with major benefits for local residents, including the use of out-of-state workers, royalty ownership patterns, the high level of out-of-state ownership amongst oil and gas operators, spending on goods (e.g. machinery and equipment) and services from outside the region, low taxes, and the small employment multiplier from oil and gas development.
- In Belmont County, Ohio – which is at the epicenter of the shale boom – total mining (mostly all oil and gas) GDP grew by $3.7 billion or 150% from 2013 to 2018, while total compensation for all workers in the county grew by only $141 million or 12% across all industries.
How is GDP measured?
At the national level, GDP is typically calculated using the “expenditure approach”, which is the sum value of personal consumption, private investment, government spending and net exports. It looks like this:
GDP = personal consumption + private investment + government spending + net exports (imports less exports).
At the state and county level, GDP is measured by using the “income approach” that adds up the incomes earned by labor (employee compensation) and capital (also called Gross Operating Surplus) and the costs of production (business taxes):
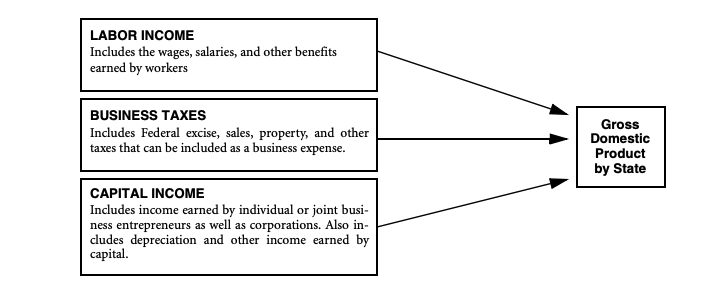
The general formula for computing state and local GDP is similar to the diagram above, and is calculated by the sum of employee compensation (COMP), taxes (federal, state, and local) on production and imports (TOPI) less subsidies (SUB), and gross operating surplus (GOS). The formula looks like this: GDP = COMP + TOPI – SUB + GOS
The national and state/county approach to measuring GDP are conceptually equivalent, each just has a different way of arriving at the value-added. While GDP does not capture the distribution of income among workers (e.g. between CEOs and production workers), it does provide a window into how much of the value-added produced by an industry is received by all labor (i.e. employees including the CEO, the production workers, and others).
Typically, the “labor share” of GDP is the largest component of GDP (see graphs below), making up more than half of GDP on average today. Changes in the labor share can be indicative of a gap between growth in productivity and growth in compensation. Over the last decade, economists have noted that the labor share in the United States has been declining for decades, especially since 2000, for a variety of reasons. These include technology improvements, higher rates of capital depreciation, the growth of intangible assets (intellectual property), automation, consolidation, declining labor power, and rising commodity prices in the energy sector.
In some industries – especially mining and oil and gas extraction that are very capital intensive – most of the income flows to capital owners. The amount of income flowing to labor or capital in the oil and extraction industries depends heavily upon the price of oil and natural gas, the phase of production, and the amount of capital investment. Typically, most of the labor costs (or income) are incurred during the initial drilling phase; as a well becomes more productive, more of the income flows to owners who pay for capital costs (fixed investment), royalties, etc.
Ultra-Low Labor Share of Oil & Gas Industries
The graph below shows the components of Ohio’s GDP for all industry sectors combined and for mining and oil and natural gas extraction. In 2017, Ohio’s GDP for all industries was $645 billion. Of this amount, 54% or $349 billion was labor income or employee compensation while business taxes (minus subsidies) comprised $43 billion or 7%. The capital income component or gross operating surplus was $253 billion or about 39% of GDP. The gross operating surplus (GOS) represents what is left after employees, suppliers, and net taxes are paid. GOS is not the same thing as profits. It includes depreciation of assets, corporate profits, other payments, and what is available to those that own the firm or hold its debt.
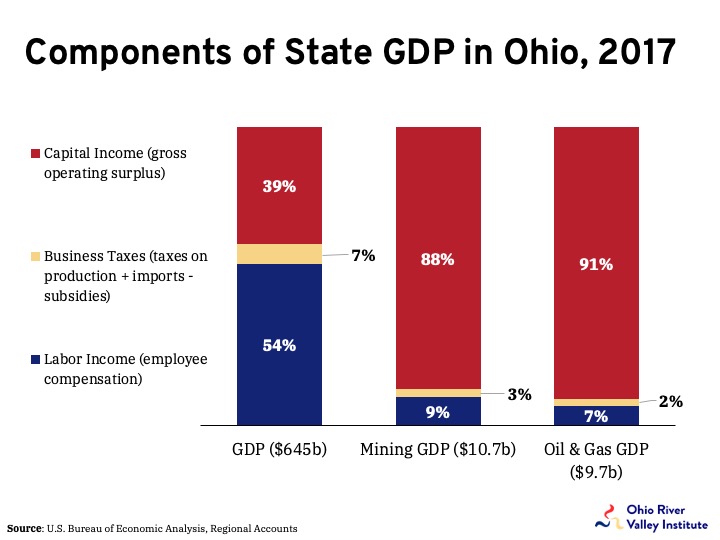
As the graph makes clear, the business tax and labor shares of GDP are much lower than the economy-wide averages in extractive industries. While net business taxes make up 7% of total industry GDP in Ohio, they make up just 2% to 3% in both mining (which includes coal mining, quarrying, oil and gas extraction and support activities) and the oil and gas portion of mining (which excludes coal mining). Meanwhile, capital income makes up around 90% of mining/oil and gas GDP compared to 39% for all industries. Labor income makes up a correspondingly smaller share of GDP – less than 10% as opposed to more than half (54%) economy-wide.
The next graph looks at the labor share of GDP for Ohio, Pennsylvania, and West Virginia. For each state, the labor share of all industries ranges between 53% to 55%. In contrast, the labor share for mining (coal, gas, and oil extraction) is between 9% and 28% while the labor share for oil and gas extraction is lower – between 7% and 19%.
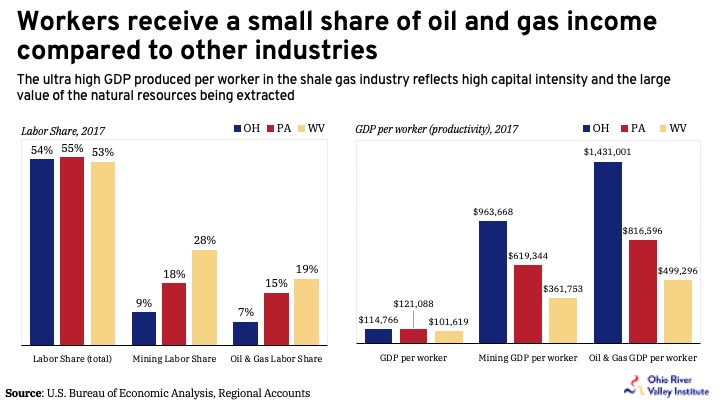
The small labor share in the oil and gas industries also is reflective of the small number of workers it takes to produce a large amount of GDP. For example, a typical worker in these three states produced around $115,000 in GDP in 2017, according the U.S. Bureau of Economic Analysis. A worker in the oil and gas industries typically produced upwards of $1.4 million or nearly 10 times the amount of GDP per worker. The ultra-high GDP per worker and small labor share of GDP is reflective of how capital intensive the oil and gas sector is and the large value of the natural resources being extracted.
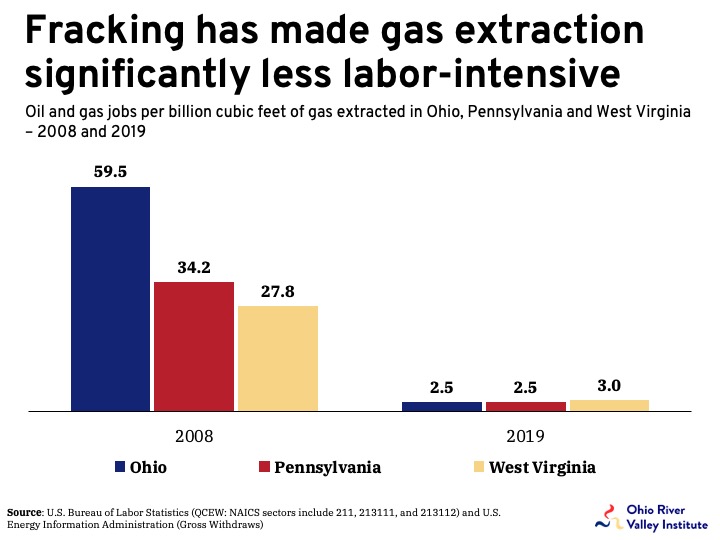
The advent of hydraulic fracking in horizontal well drilling has led to sharp increases in productivity in the oil and gas sector, with fewer workers producing more gas and oil than conventional drilling. As the graph below highlights, the number of oil and gas jobs per billion cubic feet (bcf) of natural gas extracted has plummeted in all three states. For example, in Ohio, the number of jobs per bcf fell from nearly 60 in 2008 to less than 3 jobs per bcf in 2019.
Over the last decade, oil and gas GDP have grown dramatically in Pennsylvania, Ohio, and West Virginia. The graph below looks at nominal GDP growth for the mining sector as a whole, and the oil and gas extraction sector alone. Included in the oil and gas sector is “support activities for mining” that contain a small portion of jobs in coal mining and other types of rock and mineral extraction. While GDP growth is usually adjusted for inflation to calculate real GDP growth – usually chained dollars to a certain year (e.g. 2012) – the Bureau of Economic Analysis (BEA) is unable to accurately measure inflation for the mining sector because of the extreme volatility of energy prices on the commodities markets and the timing of production (for more on this topic, see this article by the Federal Reserve Bank of Dallas). The distorted mismeasurement of real output often inflates the economic output of the mining sector, usually making it much larger than it would be. Therefore, nominal GDP is used.
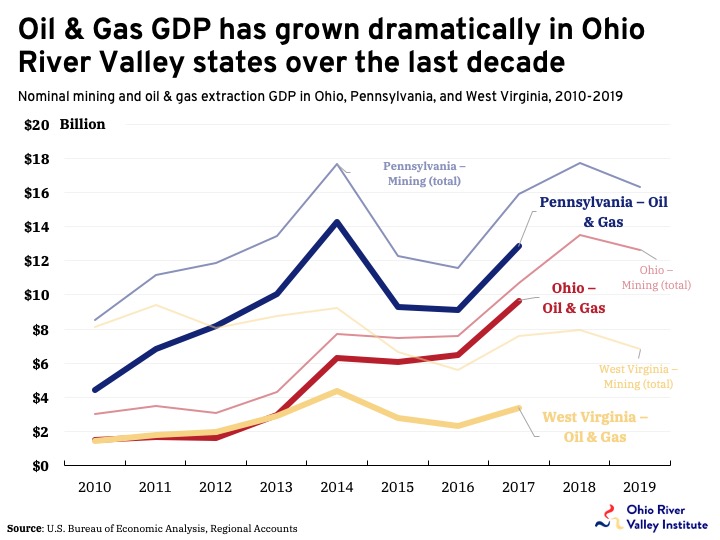
As the graph shows, from 2010 to 2017 oil and gas GDP grew from about $4.5 billion to $12.9 billion in Pennsylvania, $1.5 billion to $9.7 billion in Ohio, and $1.5 billion to $3.4 billion in West Virginia. While there is no data for 2018 or 2019 for the oil and gas sector, most of the mining GDP growth for these years is most likely attributable to the shale gas industry since coal mining has declined or stagnated in all three states.
While total oil and gas GDP grew by $18.5 billion for the three Ohio River Valley states from 2010 to 2017, total compensation (wages and benefits) only grew by $1 billion – from $2.2 billion in 2010 to $3.2 billion in 2017, according to the Bureau of Economic Analysis.
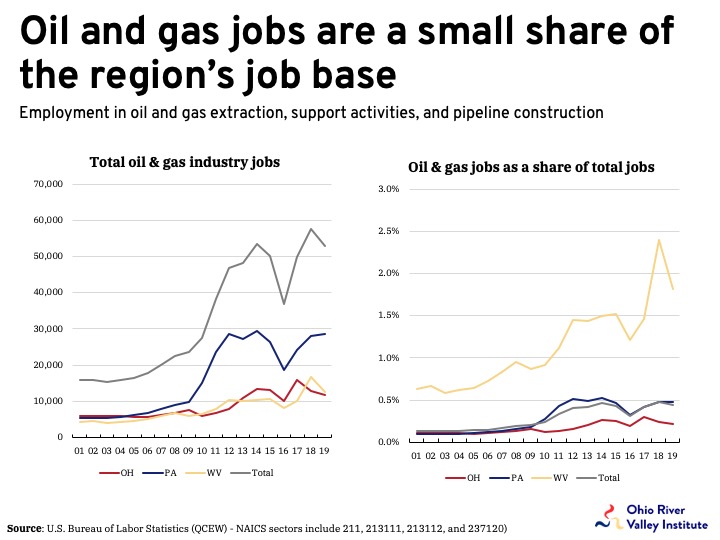
The sharp rise in GDP growth has increased the number of jobs in the oil and gas industry, but these jobs represent only a small fraction of the total jobs in the three states. Altogether, there are approximately 53,000 employees in the oil and gas industry in Ohio, Pennsylvania, and West Virginia – making up less than 0.5% of total employment. These industries include oil and gas extraction, support activities for drilling and operations, and pipeline construction.
Another reason the contributions to GDP and employment from the oil and gas industries may not correspond with benefits to local residents is that a substantial portion of the oil and gas workers are from out-of-state and are not residents of the region. An 2015 analysis by WorkForce West Virginia found that over 40% of oil and gas pipeline workers in West Virginia where not West Virginia residents.
Furthermore, a portion of the royalty income may be recorded as local income but transferred out of the region or state because many of the landowners do not live locally and much of the acreage is concentrated in a relative small number of people. The economic impact of the royalty income is heavily dependent on where and how the income is spent or saved.
While large capital investment (inputs) can spur GDP growth, the local economic impact of this investment is heavily contingent on where the capital (machinery, equipment, inventory, etc.) is manufactured and the amount of tax revenue collected from these investments. According to U.S. Bureau of Labor Statistics (QCEW), there were 59,458 jobs in the oil and gas field machinery and equipment manufacturing sector in the United States in 2019. Pennsylvania, Ohio, and West Virginia accounted for only 1.1% or 676 of these jobs. Eighty seven percent of these jobs nationally were in Texas and Oklahoma. Meanwhile, only 11% of industrial gas manufacturing jobs and 4% of (gas) turbine manufacturing jobs were in the region in 2019.
It is also important to recognize that a significant amount of spending in the oil and gas sector will be for materials, professional services, financing, and other labor acquired from outside the region. And, once these capital-intensive assets are built, much of the income goes to capital and to suppliers and service providers from outside the region resulting in relatively less income entering the local economy.
Another reason our region captures little of the economic benefit of mining and oil and gas extraction: low state and local taxes on these industries. While West Virginia has a property tax on tangible business property, Ohio and Pennsylvania do not. West Virginia also has a 5% state severance tax and a local production tax on producing gas property, while Ohio has a small severance tax and local property tax on producing gas property and Pennsylvania has a small impact fee (2.1% effective rate) and no tax on natural gas property. To put this in perspective, West Virginia collected $133 million in state oil and gas severance taxes in 2018 and $93 million in property taxes in 2017. The state of Ohio collected just $38 million in severance taxes and $48 million in property taxes in 2017, while producing 600 billion cubic feet more than West Virginia in 2017.
Spotlight on Belmont County, Ohio
The small county of Belmont, Ohio has been at the epicenter of the shale boom. In 2019, the county produced more gas than any other county in Ohio, 933 billion cubic feet or about 36% of all horizontal gas extracted in the state. From 2014 to 2019, over 3.5 trillion cubic feet of gas has been extracted from Belmont county or an estimated $9.5 billion in production value. According to the shale industry, total shale related investment in the region from 2011 to mid-2019 was $83.3 billion in Belmont and surrounding counties in Ohio.
The fracking boom in Belmont County has significantly grown the county’s GDP, but it has not led to large growth, overall in the county’s population or job base. From 2013 to 2018, total GDP in Belmont county grew by about $4 billion or from $2.4 billion to $6.4 billion. Meanwhile, mining GDP grew by $3.7 billion over this period. This means about 95% of Belmont County’s GDP growth came from oil and gas extraction this five-year period. While total GDP and mining GDP in Belmont County grew over 150% in five years, total compensation (wages and benefits) for all workers only grew by 12% ($141 million) across all industries, and mining compensation just 5% ($10.4 million).
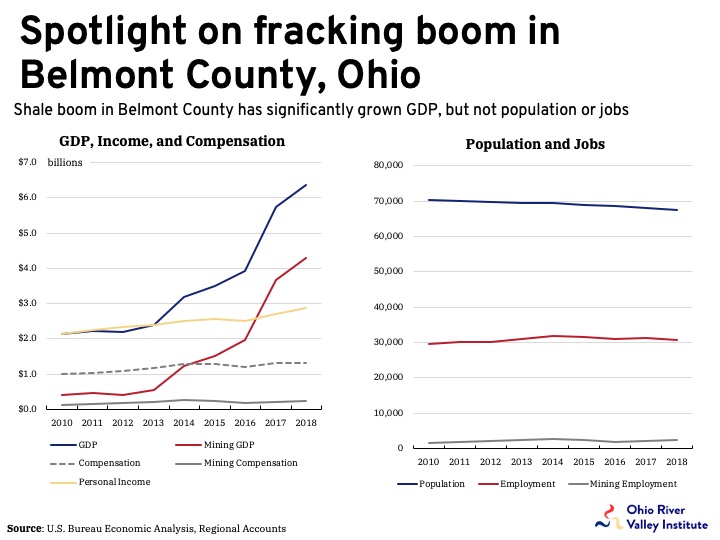
Total nominal personal income (compensation, royalty income, dividends, government transfer payments, etc.) to people who live in Belmont County grew $482 million, from $2.4 billion to $2.9 billion, from 2013 to 2018. The disconnect between personal income and GDP is apparent since about 2013-14. While personal income was roughly equivalent to GDP in Belmont County before the shale fracking boom, now GDP is more than double that of the personal income in the county, $2.9 billion compared to $6.4 billion, respectively.
In 2014, the GDP per worker in the county was $77,400, but by 2018, it grew to over $206,000 per worker, according to the Bureau of Economic Analysis.. Similarly, mining GDP per worker grew from $226,000 in 2013 to over $1.8 million per worker. Per capita income in Belmont County, Ohio was $42,429 in 2018, or about $6,300 less than the state average of $48,739. These large gaps between income and GDP are reflective of the value of the gas that is being extracted, and of how little income is flowing into the local economy.
While growth from the oil and gas sector has led to significant GDP growth for Belmont County, the number of jobs and the number of people living in the county has stagnated or declined. According to the Bureau of Economic Analysis, total employment from 2013 to 2018 declined by 114 jobs and total mining employment declined by 55 jobs. While mining GDP comprised 68% of the county’s total GDP, mining compensation made up just 18% of compensation with mining employment less than 8%. Meanwhile, the county has seen its population decline by over 2,000 people during this period. One bright spot in Belmont County has been growth in property taxes, from $43 million in 2013 to $99 million in 2019. However, this growth in taxes is a drop in the bucket compared to overall growth in GDP from gas extraction.
Conclusion
Over the last decade, the shale fracking boom in the Ohio River Valley has led to massive growth in the oil and gas industry in the region. The extraction of natural gas, oil, and natural gas liquids in Ohio, Pennsylvania, and West Virginia has generated billions of dollars of income and investment. The region now accounts for about 30 percent of the nation’s gas production. While these contributions of extractive industries to regional GDP growth have been large, the reality is that only a small fraction of the income being produced stays within local communities and in the pockets of local workers. The GDP generated doesn’t capture how much wealth flowing from oil and gas extraction in the region stays in the region. One key reason is the high level of out-of-state ownership amongst oil and gas operators, many of which are headquartered in Texas and Oklahoma.
Another reason jobs in the oil and gas industry do not lead to more job growth is the low employment multiplier compared to other industries. Recent research on county level impacts of shale development found that the local employment multiplier from oil and gas development to be just 1.3. This means that for every job oil and gas job only 1.3 other jobs are created. Economist Robert Pollin determined for every $1 million in spending on solar and wind produces twice as many jobs than oil and natural gas.
GDP growth may give us an idea of how much income is being generated, but in extractive industries it says little or nothing about the economic benefits, or social and environmental consequences. To produce sustainable economic growth, the Ohio River Valley region would be better served by embracing the clean energy. Clean energy creates more jobs without the swath of negative externalities, such as polluted drinking water, lower home values, worse health outcomes, slower long-term income growth, and without exacerbating the climate change crisis.