If policymakers at the state and federal level want to build a strong economy with good paying jobs in the Ohio River Valley region it will require raising wages, improving job quality standards, and increasing disposable income of workers. That’s because most new jobs in the Ohio River Valley are projected to pay median wages that are below a living wage. Boosting educational attainment will not be a cure-all for workers in the labor market of the future, as most new jobs will not require a post-secondary degree.
If elected officials and other policymakers do nothing:
- more than 7 in 10 annual job openings by 2028 will pay less than what it takes to meet minimum standards of living;
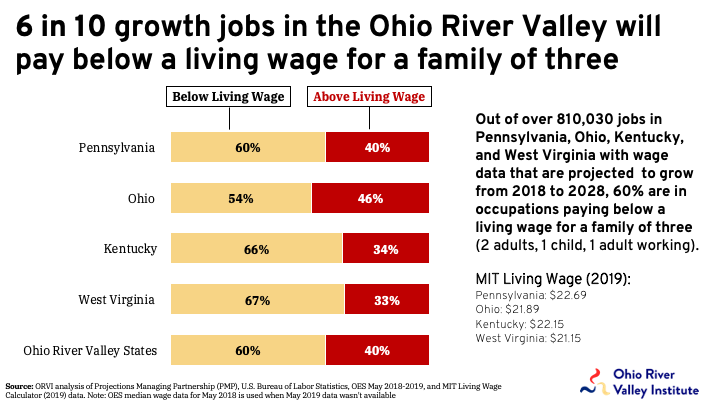
- approximately 60% of job in growing occupations will pay below a living wage for a family of three;
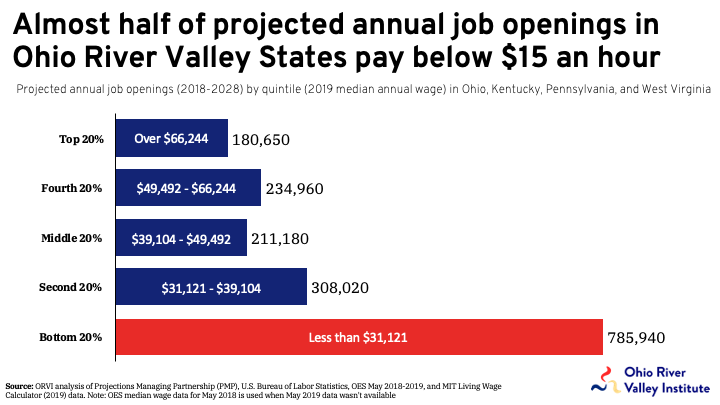
- and almost half of projected job openings in Ohio River Valley states will pay below $15 an hour (2019 dollars).
The good news is that it doesn’t have to be this way. By building a new economy, with clean energy jobs, and supporting policies that boost incomes and lower household costs for workers and families it is possible to ensure more people can make ends meet and thrive.
Background on Occupational Employment Projections
Each year the U.S. Bureau of Labor Statistics (BLS) publishes employment projections over a ten-year period that include approximately 790 occupations across 295 industries. The projections are categorized into 22 major groups using the Standard Occupational Classification (SOC) system. Occupations are classified by the type of work performed, job tasks, and job duties. For example, orderlies, nursing assistants, and home health aides are included in the broader health support occupations group.
The projections include both “employment growth”, which is the net change in occupational employment over the ten-year period, and the number of annual “job openings”. Job openings differ from employment growth in that they represent replacement needs in addition to employment growth. Job openings arise when someone leaves their occupation and they need to be replaced.
Reasons for leaving can include retirement, enrolling in school, or shifting to another occupation (occupational transfer) such as management. Job openings are generally much higher than employment growth. For example, if an occupation is expected to gain 5,000 new jobs and 10,000 people who work in the occupation are expected to leave the occupation over the next ten years, then the total number of projected job opening is 15,000. Having a high ratio of job openings to employment growth can reflect demographic considerations, such as having an older workforce (e.g. Baby Boomers) that will soon retire or slow population growth. In general, only a small share of aggregate “job openings” are because of net occupational employment growth.
A Low-Wage Future in the Ohio River Valley
According to state-level occupation projections from Projections Central, which uses the national BLS Occupational Employment Statistics projections cited above, most new jobs in the Ohio River Valley will pay median wages that are below a living wage. Between 2018 and 2028, Pennsylvania, Ohio, Kentucky, and West Virginia are expected to see about 18 million total job openings, an average of 1.8 million job openings per year.
Out of about 17.2 million total job openings that contain wage data (small occupations and those that are not “year-around, full-time” often do not contain wage data) in the four states, approximately 12.6 million of the jobs (73%) are in occupations that pay less living wage for a family of three.
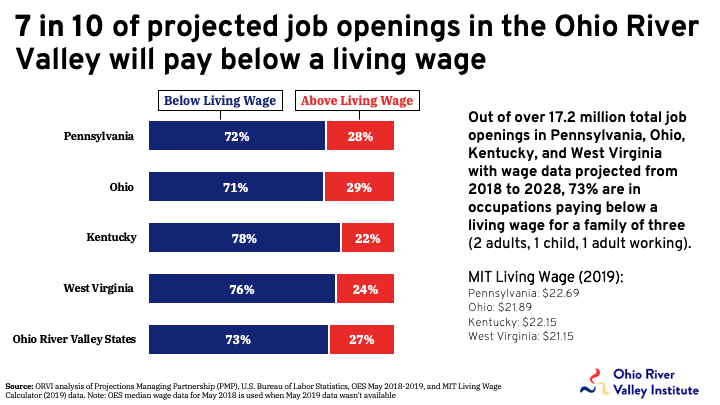
The local wage that allows residents to meet minimum standards of living is between $21.15 and $22.69 in the four-state region, according to the Living Wage Calculator from the Massachusetts Institute of Technology (MIT). This is the hourly wage needed for a family of three that includes two adults (one adult working full-time) and one young child. By this definition, a living wage provides a household income close to 200% of the federal poverty level or twice the ridiculously low federal poverty threshold.
In West Virginia and Kentucky more than 3 in 4 new jobs (76% and 78%) are projected to pay less than a living family wage for three, while more than 7 in 10 projected job openings in Ohio and Pennsylvania will be in low-wage occupations. The occupations with the most projected job openings in each state are also the occupations with the most employees today, such as retail salespersons, cashiers, registered nurses, and home health and personal care aides.
While most occupations will have job openings over the next decade, some of the occupations are projected to have a net decrease in employment. For instance, the projected number of job openings for cashiers from 2018 to 2028 in the four-state region is 29,750. However, the total number of cashiers jobs in the region is expected to decline from 165,300 to 157,930, a decrease of 7,730. This reflects the high level of turnover in this occupation and that there will be less demand for cashiers in the future. This is why it is important to look at occupational job openings and total occupational employment growth or “growth jobs”.
Total employment is projected to grow by over 620,000 in the four-state region from 2018 to 2028, from 14.9 million to 15.5 million. Among the occupations that are projected to grow over this period that contain wage data, 60% (483,660) pay median wages less the living wage for a family of three while 40% (326,370) pay above this amount.
The following table shows the combined top 20 occupations for the four states, ranked from highest number of annual job openings between 2018 and 2028. Among the top 20 occupations listed, 18 of the occupations have a median hourly wage below a living wage for a family of three. Moreover, only 3 of the top 20 occupations require more than a high school diploma. These low-wage occupations are also disproportionally made up of women, people of color and those born outside the United States.
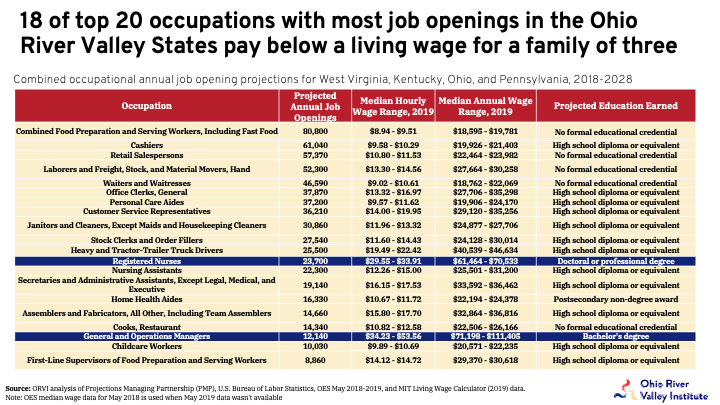
While the BLS assumes that many of the low-wage occupations are full-time, year around (40-hour work week or 2080 hours per year), actual pay for people in these occupations is likely lower since many of these jobs are in part-time work with high-turnover, such as cashiers and childcare workers that report working less than 40 hours per week.
Another way to slice the data is by looking at projected annual job openings and median wages by quintile – or dividing them by five equal segments. As the graph highlights, the lowest quintile includes occupations that pays a median wage below about $15 an hour or $31,121 annually while the highest quintile includes jobs that pay above about $32 an hour or over $66,244 annually. Of the 1.7 million projected annual job openings with wage data, almost half or 46% pay below $15 an hour and 76% pay below $50,000 annually. Meanwhile, about 10.5% of projected annual job openings are in the top quintile, paying median wages above $32 an hour.
Health, mathematical and “green job” sector occupations are projected to grow fastest
The fastest growing occupations in the Ohio River Valley states are a mix of low and mid to higher paying jobs. Among the top five occupations with the highest percent change in employment from 2018 and 2028, personal care and home health aides are low wage occupations, while the high-paying occupations are in mathematical fields (statisticians) and health-related fields (requiring more advanced education attainment (physician assistant and nurse midwives). While most of the fasting growing occupations are not projected to add the most new jobs, they reflect job growth momentum in certain areas such as STEM (Science, Technology, Engineering, and Mathematics) and growing demand for medical care.
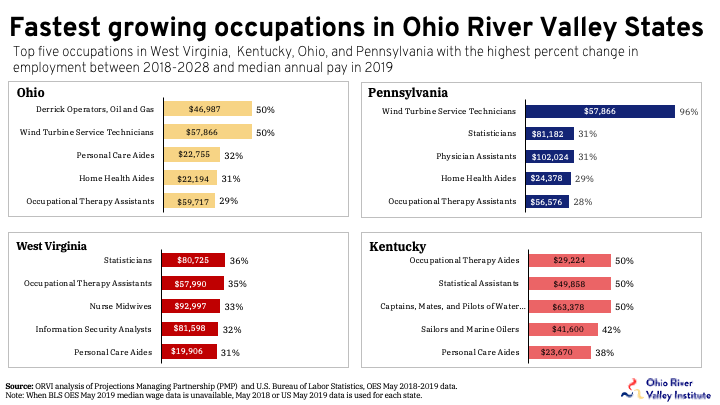
Two of the fastest growing occupations in Ohio and Pennsylvania are wind turbine service technicians, which are in the “green jobs” sector. Of note is that the median annual pay for wind turbine service technicians in Ohio and Pennsylvania is more than $10,000 higher than for derrick operators in the oil and gas industry, which is projected to be the fastest growing occupation in Ohio.
A recent study by E2 (Environmental Entrepreneurs) found that occupations in clean energy industries had median wages of $23.89 in 2019 compared to $24.37 an hour for jobs in the coal, natural gas and petroleum industries. Meanwhile, the study found that jobs in solar and wind pay $24.85 while jobs in energy efficiency – the largest part of the American’s energy sector – had median wages of $24.44 an hour. The unionization rate and the share of jobs with health care and retirement benefits in clean energy jobs was also higher than the rest of the private sector.
Turning Low-Wage Jobs into Living Wage Jobs
One thing is clear about the future of jobs in the Ohio River Valley states; most will not require a four-year college degree and most of the new job openings will be in low-wage occupations such home and personal care aides that require a high-school diploma or less. This means that part of any economic strategy toward moving this region toward shared prosperity has to include improving labor standards and job quality. Our communities cannot function without the workers that are currently in low-paid occupations and it’s imperative not only to expand educational opportunities so people can move up the economic ladder but also pay blue- and pink-collar workers so they can support themselves and their families.
Since the demand for high-school-educated workers is large and will grow in the future, effective strategies for the region will improve job quality and increase disposable income for low-wage workers. The Economic Policy Institute has outlined 15 commendable policies to build worker power and boost job quality, including raising the minimum wage and making it easier to unionize. Other policies to support working families will reduce expenses and increase disposable income through securing:
- universal health and childcare;
- tuition-free college and apprenticeship programs;
- increased access to affordable public transportation and housing;
- lower utility bills through energy efficiency and customer owned utilities;
- and unrigging our economy that tends to redistribute income upwards.
As mentioned above, many of the jobs in the “green economy” pay as well or close to what jobs pay in fossil fuel extraction. As the country moves toward meeting climate goals it will be essential that communities in the Ohio River Valley receive large scale federal investments in infrastructure, energy efficiency, abandoned coal mine and oil and gas well reclamation, and that policies help guarantee that former fossil fuel workers have jobs and financial assistance.
Putting more income in the pockets of workers will not only improve social outcomes such better health, less inequality, and a better quality of life but also build a more sustainable and stronger economy. The more people who have financial stability and economic security through higher wages and disposable income the more jobs and economic activity supporting our local communities. When wages are low, people and communities suffer, as financial hardship acts like a drain on a state’s economy. Additional wages earned by workers yields an increase in consumer spending, which in turn spurs business growth and additional tax revenues to invest back into our communities.
_______________
Appendix
The total number of job openings projected for West Virginia, Ohio, Pennsylvania, and Kentucky from 2018 to 2028 by Projections Central was 1,796,710. Of this amount, 1,720,750 or 95.8% contained wage data that could be counted in the estimates used in the analysis. The total projected net employment growth in the four-state region from 2018 to 2028 is 620,390. This includes occupations with growth and negative employment growth over this period. The total for projected ‘growth’ jobs for the four states is 847,740, of which 810,030 contained wage data, and the total with negative growth was 229,330.
Wages for some occupations are not published because the relative standard error was too high (small sample size), the occupations are not “year-around, full-time”, or the wage is greater than $100.00 per hour or $208,000 per year. Many of the Educational Instruction and Library Occupations (Occupation code 25) did not include wage data. Occupational data does not include self-employed. When BLS OES median wage data for certain occupations wasn’t available for May 2019, May 2018 data or US May 2019 data was used to calculate median wage by occupation.