Workers in West Virginia should be making $117,000 a year on average — and they would be too, if only we had pursued the same economic strategies we had in the 1970s. Instead, we’ve taken power away from workers, lowered taxes on the wealthy, and designed an economic system that redistributes money upward. That $117k figure may sound implausible, but it’s not. In fact, it comes from a detailed new study by the Rand Corporation.
The study finds that the upward redistribution of income over the last four decades has taken trillions of dollars from workers. We’ve know for several decades that income inequality has been growing in the United States, mainly from a lack of bargaining power of workers and other rules that have stacked the deck on working families. This paper looks at the massive growth in income inequality over the last 45 years by comparing growth trends in income (e.g. wages) and gross domestic product (GDP). This research is unique in that it asks what would have happened to income growth for workers in different income brackets had it grown at the same rate as the economy or gross domestic product (GDP) . The paper finds that:
…the cumulative effect of four decades of income growth below the growth of per capita gross national income and estimate that aggregate income for the population below the 90th percentile over this time period would have been $2.5 trillion (67 percent) higher in 2018 had income growth since 1975 remained as equitable as it was in the first two post-War decades. From 1975 to 2018, the difference between the aggregate income for those below the 90th percentile and the equitable growth counterfactual totals $47 trillion.
In other words, the inequality that is baked into our economic system costs workers approximately $2.5 trillion each year. To put this in perspective, the study finds that the typical full-time worker – the one in the middle of the income distribution or median – would have an annual earnings of about $92,000 a year instead of the $50,000 they make today. That’s a difference of $42,000 annually.
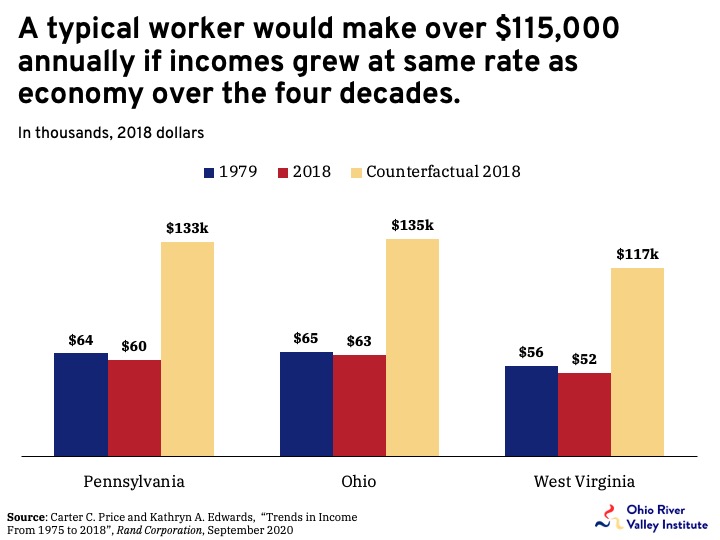
In the states that make up the upper Ohio River Valley, a similar pattern is found, with typical workers making less today than they did in 1979 after adjusting for inflation (see graph below). For example, a full-time, year-around worker in West Virginia makes $4,000 less today (2018) than they did in 1979. If this worker’s income grew at the same rate as the state’s GDP from 1979 to 2018, they would have made $65,000 more in income or $117,000 instead of $52,000.

While there are a few limitations of the study, it paints a powerful picture of one of the greatest problems of the past 40 years. Economic inequality is at the root of most of society’s problems. As income gets to an adequate level, almost all of the bad indicators – such as poor health and short life expectancy, higher crime rates and childhood trauma, poverty, and low educational attainment – tend to decline. Scholars are also finding out that income and wealth inequality is bad for economic growth, democracy, and even the rich.
To combat income and wealth inequality in the United States and in the Ohio River Valley, it is going to take action at the state and federal level. This includes enacting policies that will unrig the system that has favored the rich over the last 40 years, including improving labor standards (e.g. raising the minimum wage and making it easier to join unions), raising taxes on the wealthy, breaking up monopoly power, transitioning to a clean energy economy, and enacting universal policies, such as Medicare for All, a child allowance, free public child care and pre-k, tuition-free college, and many more.

